Project 3 - Prototyping Systems of Communication
How often do we open our fridge and does temperature and light play a factor?
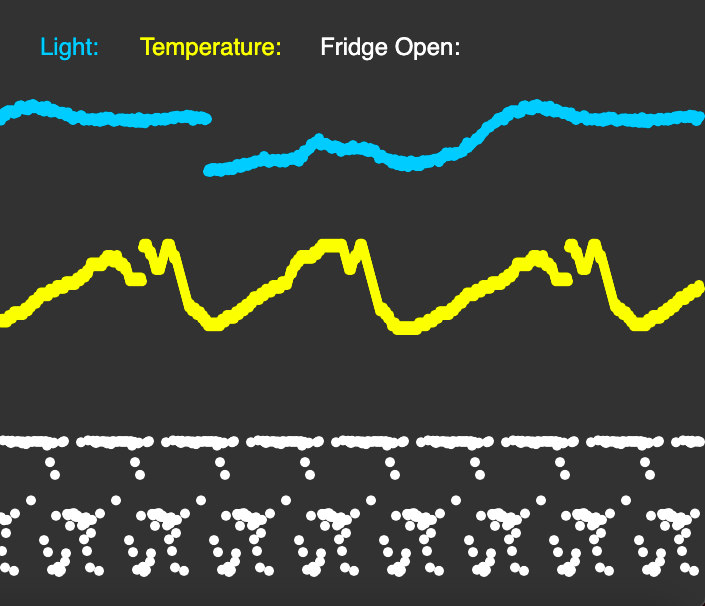
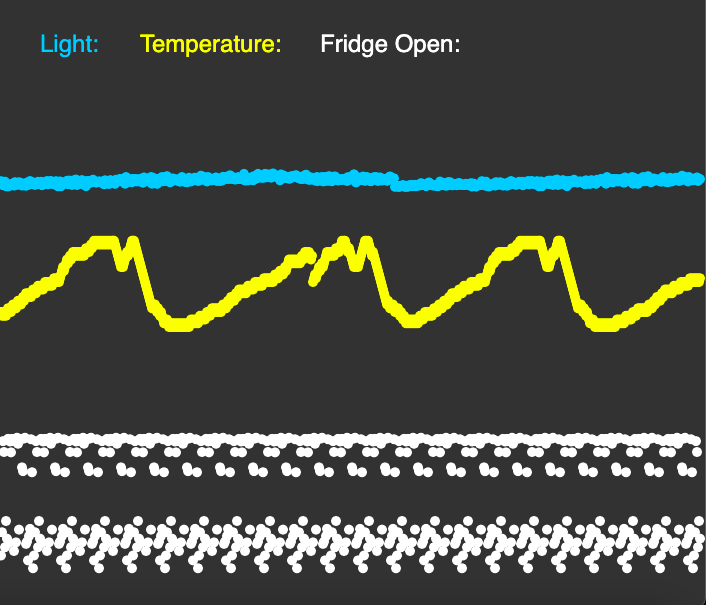
Using a temperature, light, and proximity sensor I was able to capture and store data,
allowing me to create graphical elements that allowed me to visualize the amount of times
a person would open the fridge and if temperature and time of day played in as a factor.
One of the challenge throughout this project was trying to visualize theses data entires
in way that could be easily compared to the others data entires. So by creating a graphical
chart, it helped to me to be able to fully visualize the data as well as compare it to the
other data point entires.
Visual Examples